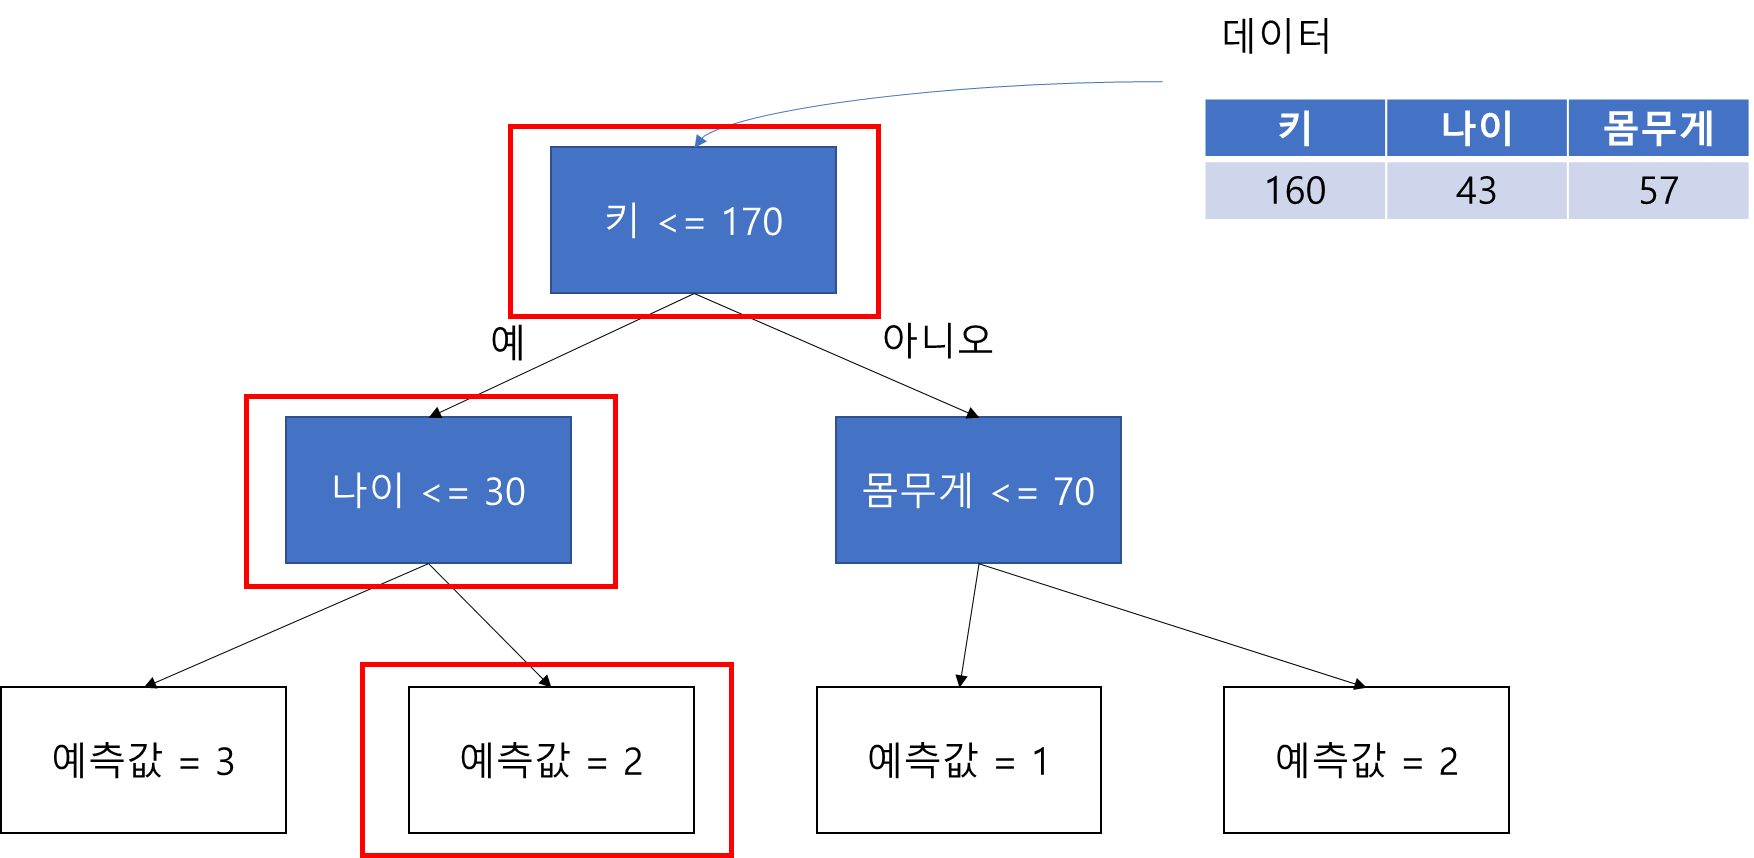
의사결정 나무(Decision Tree)를 학습한 뒤 주어진 데이터가 진행한 노드들의 정보를 알고 싶을 때가 있다. 예를 들어 노드에서 분리할 때 사용된 변수와 분리 기준을 알고 싶을 때가 있을 것이다. 만약 아래 그림에서 의사결정 나무 모형이 있고 주어진 데이터에 대해서 예측을 수행하면 빨간 박스에 있는 노드(마디)들을 진행할 것이다. 이때 진행한 노드 중 중간 노드에 포함된 변수와 분리 기준은 (키, 170), (나이, 30)이 되며 마지막 터미널 노드에서의 예측값은 2인 것을 알 수 있다.
Scikit-Learn(sklearn)에서는 이러한 나무 기반 모형에서 decision_path를 이용하여 주어진 데이터가 진행한 노드 아이디를 알 수 있고 이를 이용하면 진행 노드의 정보를 가져올 수 있는 것이다.
이번 포스팅에서는 decision_path를 이용한 노드 정보 가져오는 방법을 소개한다.
decision_path를 이용한 노드 정보 가져오기
먼저 필요한 모듈을 임포트하고 데이터를 불러온 뒤 의사결정나무를 하나 학습해준다. 데이터는 보스턴 집값 데이터를 사용했다.
import numpy as np
import pandas as pd
import graphviz
import warnings
warnings.filterwarnings('ignore')

from sklearn.datasets import load_boston, load_iris
from sklearn.tree import DecisionTreeClassifier, DecisionTreeRegressor, export_graphviz

boston = load_boston()

df = pd.DataFrame(boston.data, columns=boston.feature_names)
df['MEDV'] = boston.target
X = df.drop('MEDV', axis=1)
y = df['MEDV']

reg = DecisionTreeRegressor(max_depth=3).fit(X, y)
의사결정 나무를 시각화해보면 다음과 같다.
dot_data = export_graphviz(reg, out_file=None,
                     feature_names=X.columns,
                     filled=False, rounded=True,
                     special_characters=False)
graph = graphviz.Source(dot_data)
graph

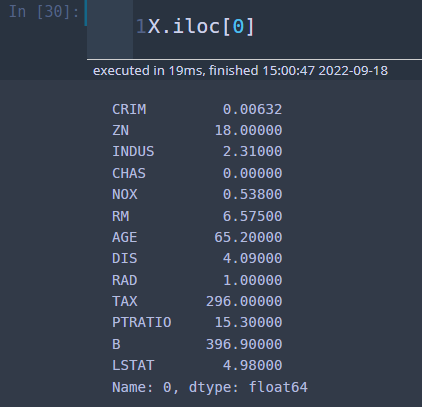
이제 데이터 하나가 주어졌고 이 데이터의 예측값을 구한다고 해보자.
X.iloc[0]
그렇다면 이 데이터가 진행한 노드들은 아래 그림과 같다.
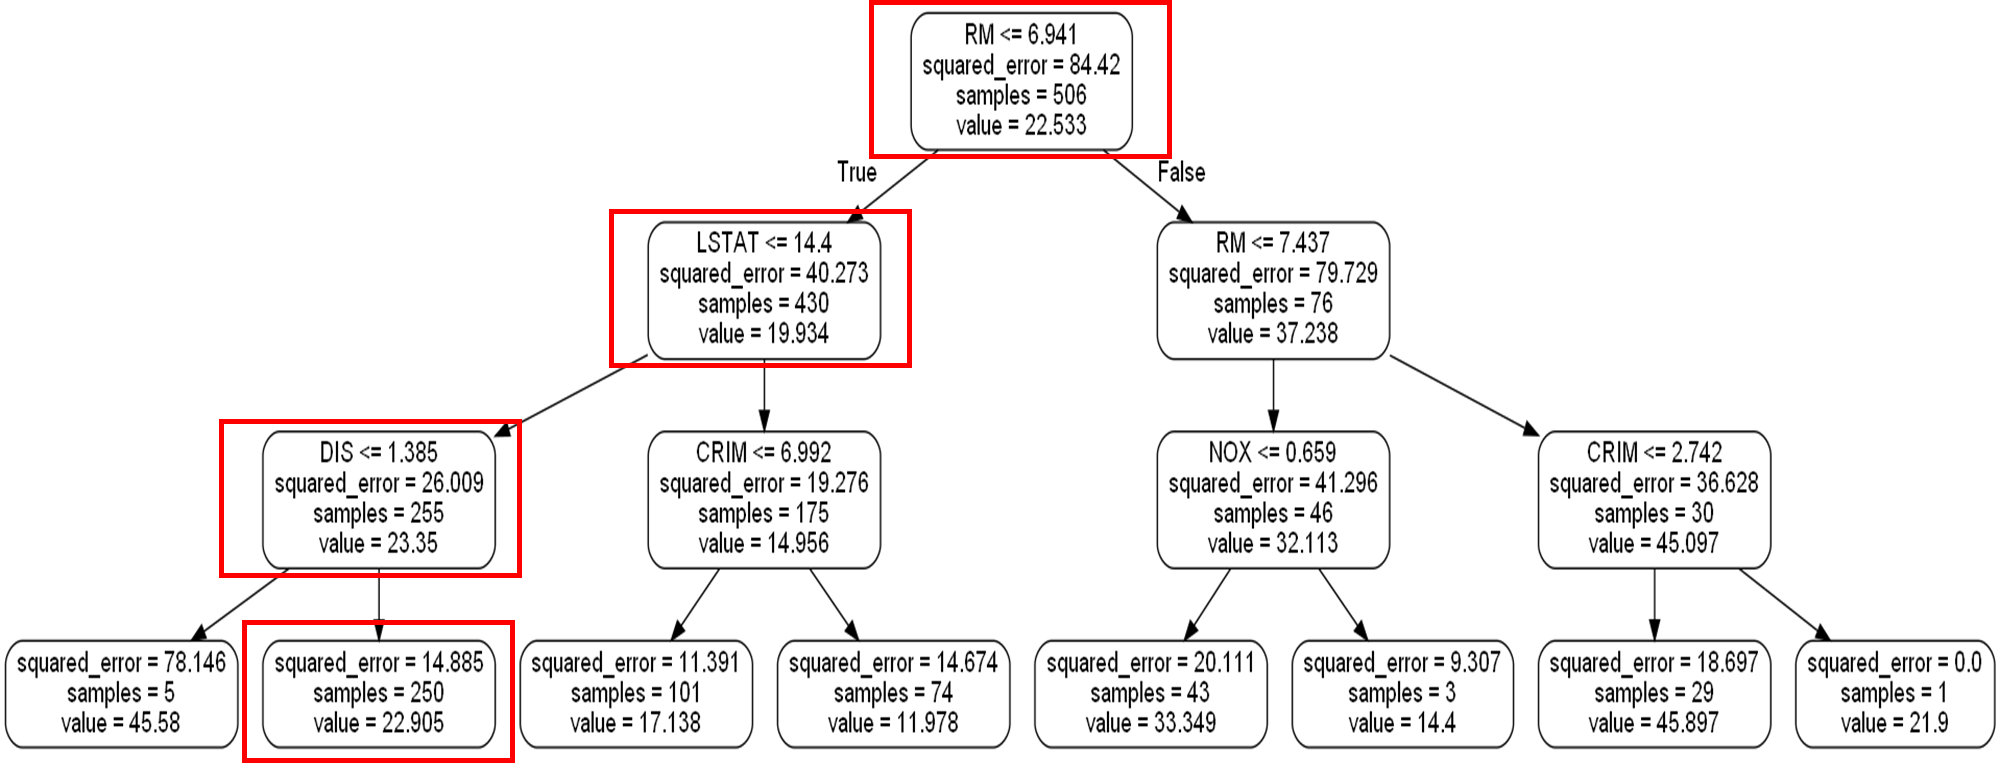
실제로 예측값을 구해보면 맨 마지막 빨간 박스의 값인 22.905가 나오게 된다.
reg.predict(X.iloc[0].values.reshape(1, -1))

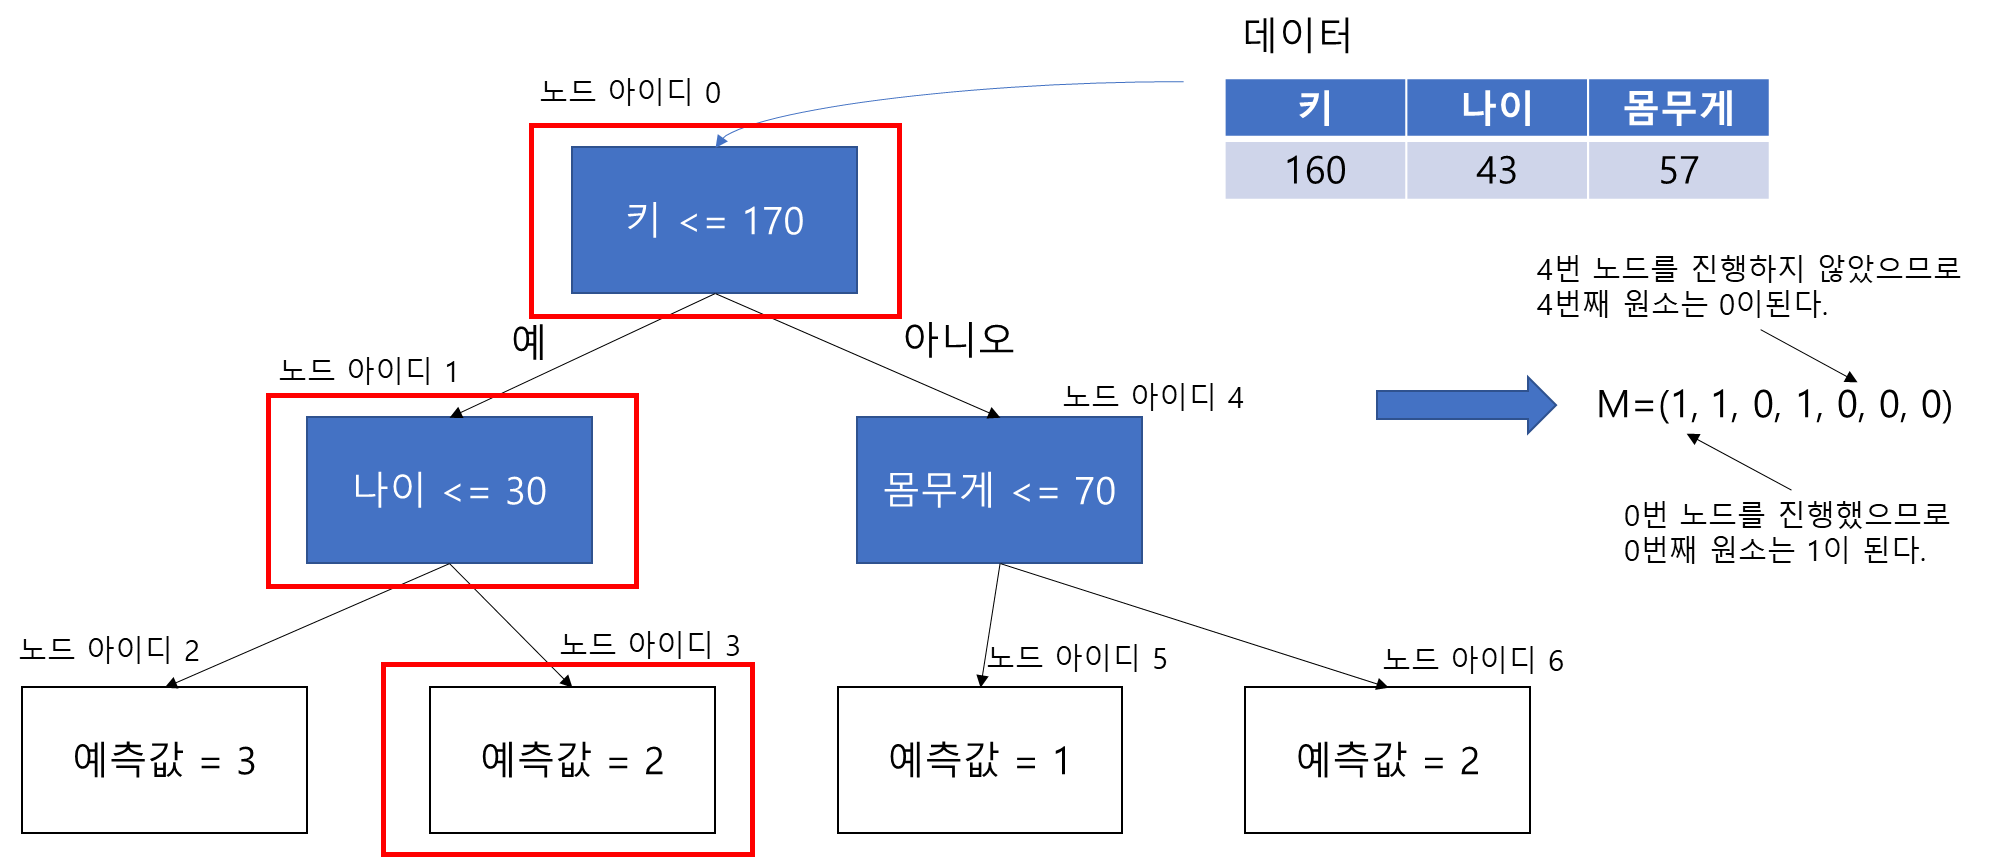
이제 decision_path가 리턴하는 값이 무엇인지 알아야 한다. decision_path는 2차원 배열을 받고 행렬을 리턴한다. 이 행렬의 행은 주어진 2차원 배열의 행을 의미하고 열은 노드 아이디가 된다. 이때 행렬을 $M$이라 할 때 $i$번째 행, $j$ 번째 열의 값 $m_{i, j}$는 0 아니면 1을 갖는다. 그 의미는 $i$번째 데이터가 노드 아이디 $j$를 진행했으면 1 아니면 0이라는 뜻이다.
실제로 decisiont_path를 집어넣으면 다음과 같다.
sample_data = X.iloc[0].values.reshape(1, -1)
mat = reg.decision_path(sample_data)
mat.toarray()
해당 데이터는 0, 1, 2, 4번 노드를 진행했음을 알 수 있다.
이제 주어진 데이터가 진행한 노드의 정보를 가져오는 함수가 아래 코드이다. get_path_node_info 함수는 학습된 모형(model), 확인하고자 할 데이터(sample_data), 변수 이름이 담긴 배열(feature_names) 그리고 모형의 타입(model_type)을 인자로 받는다. 그리고 반환하는 것은 sample_data가 진행한 노드 정보를 가져온다. 노드 정보는 노드가 터미널 노드인지 중간 노드인지에 따라 다르다. 코드에 대한 설명은 주석에 자세하게 써놨으니 참고하기 바란다.
def get_path_node_info(model, sample_data, feature_names = None, model_type='regression'):
    assert model_type in ['regression', 'classification']
    leave_id = model.apply(sample_data) ## 주어진 샘플이 도달한 터미널 노드 아이디
    features = model.tree_.feature ## 중간 노드에서 사용된 변수들
    threshold = model.tree_.threshold ## 중간 노드의 분리 기준
    if model_type == 'regression':
        predicted_value = model.tree_.value.flatten() ## 해당 노드에서의 예측값
    else:
        predicted_value = np.argmax(model.tree_.value, axis=2).flatten()
    node_indicator = model.decision_path(sample_data) ## node_id_matrix 출력

    results = []
    num_row = sample_data.shape[0]
    for row_id in range(num_row):
        node_indices = node_indicator.indices[ ## 해당 샘플이 지나간 node_id 출력
            node_indicator.indptr[row_id]:node_indicator.indptr[row_id+1]
        ]
        temp_list = []
        for node_id in node_indices:
            temp_dict = dict()
            if leave_id[row_id] == node_id: ## 터미널 노드인가?
                temp_dict['Node ID'] = node_id ## 노드 아이디
                temp_dict['Leaf'] = True ## 터미널 노드 여부
                temp_dict['Predicted Value'] = predicted_value[node_id] ## 해당 노드에서의 예측값
            else:
                if feature_names is not None:
                    feature = feature_names[features[node_id]]
                else:
                    feature = features[node_id]
                temp_dict['Node ID'] = node_id ## 노드 아이디
                temp_dict['Leaf'] = False ## 터미널 노드 여부
                temp_dict['Feature'] = feature ## 해당 노드에서의 분리 변수
                temp_dict['Threshold'] = threshold[node_id] ## 해당 노드에서의 분리 기준
                temp_dict['Condition'] = f'{feature} <= {threshold[node_id]:.3f}' ## 조건
                temp_dict['Sample Value'] = sample_data[row_id, features[node_id]] ## 주어진 노드에서의 변수에 대한 데이터 값
                if sample_data[row_id, features[node_id]] <= threshold[node_id]:
                    satisfied = 1
                else:
                    satisfied = 0
                temp_dict['Satisfied'] = satisfied
                temp_dict['Predicted Value'] = predicted_value[node_id] ## 해당 노드에서의 예측값 출력
            temp_list.append(temp_dict)
        results.append(temp_list)
    return results
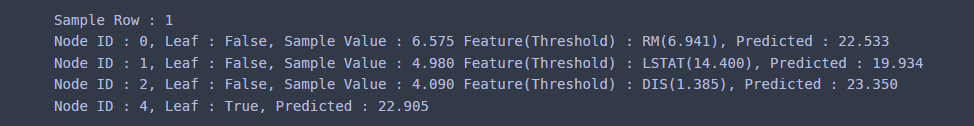
이제 노드 정보를 출력해보자. 중간 노드에는 노드 아이디, 터미널 노드 여부, 해당 변수에 대한 데이터 값 등을 출력한다.
sample_data = X.iloc[0].values.reshape(1, -1) ## 예측하고 싶은 데이터
results = get_path_node_info(reg, sample_data, feature_names = boston.feature_names)

for i, res in enumerate(results):
    print(f'Sample Row : {i+1}')
    for res_dict in res:
        node_id = res_dict['Node ID']
        leaf = res_dict['Leaf']
        pred_val = res_dict['Predicted Value']
        if res_dict['Leaf']:
            print(f'Node ID : {node_id}, Leaf : {leaf}, Predicted : {pred_val:.3f}')
        else:
            feature = res_dict['Feature']
            threshold = res_dict['Threshold']
            sample_value = res_dict['Sample Value']
            print(f'Node ID : {node_id}, Leaf : {leaf}, Sample Value : {sample_value:.3f}'
                  +f' Feature(Threshold) : {feature}({threshold:.3f}),'
                  +f' Predicted : {pred_val:.3f}')
이번엔 분류 문제에서도 잘 작동하는지 살펴보자. 데이터는 붓꽃 데이터를 사용했다.
iris = load_iris()

df = pd.DataFrame(iris.data, columns=iris.feature_names)
df['species'] = iris.target
X = df.drop('species', axis=1)
y = df['species']

clf = DecisionTreeClassifier(max_depth=3).fit(X, y)
시각화를 해보면 다음과 같다.
dot_data = export_graphviz(clf, out_file=None,
                     feature_names=X.columns,
                     filled=False, rounded=True,
                     special_characters=False)
graph = graphviz.Source(dot_data)
graph
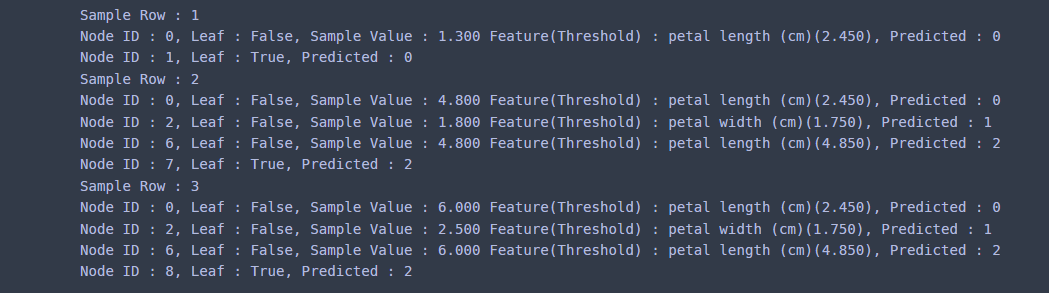
앞에서는 데이터 하나에 대한 노드 정보를 가져왔다면 이번엔 3개 데이터에 대해서 각 데이터가 진행한 노드 정보를 가져오자.
sample_data = X.iloc[[40, 70, 100]].values ## 예측하고 싶은 데이터
results = get_path_node_info(clf, sample_data,
                             feature_names = iris.feature_names,
                             model_type='classification'
                            )

for i, res in enumerate(results):
    print(f'Sample Row : {i+1}')
    for res_dict in res:
        node_id = res_dict['Node ID']
        leaf = res_dict['Leaf']
        pred_val = res_dict['Predicted Value']
        if res_dict['Leaf']:
            print(f'Node ID : {node_id}, Leaf : {leaf}, Predicted : {pred_val}')
        else:
            feature = res_dict['Feature']
            threshold = res_dict['Threshold']
            sample_value = res_dict['Sample Value']
            print(f'Node ID : {node_id}, Leaf : {leaf}, Sample Value : {sample_value:.3f}'
                  +f' Feature(Threshold) : {feature}({threshold:.3f}),'
                  +f' Predicted : {pred_val}')


댓글