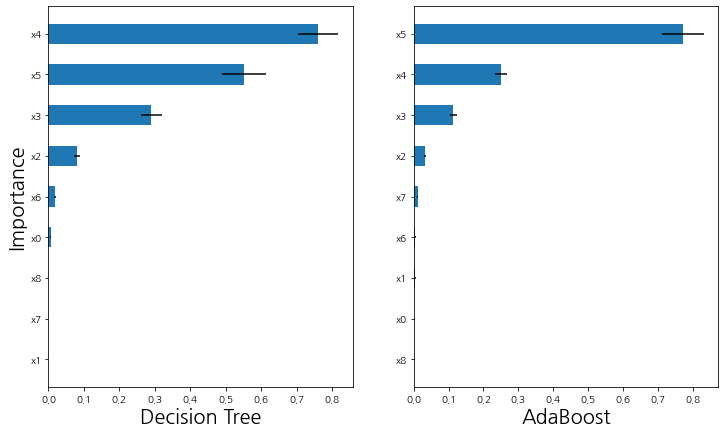
변수 중요도 방법론 중에서 Permutation Importance 이 많이 사용되는데 Scikit-Learn (sklearn)에서는 permutation_importance를 이용하여 Permutation Importance 를 계산할 수 있다. 이번 포스팅에서는 Scikit-Learn (sklearn) 에서 제공하는 permutation_importance 사용 방법을 알아보자.
Permutation Importance의 대한 아이디어와 알고리즘에 대한 내용은 여기를 참고하면 된다.
permutation_importance 사용법
먼저 필요한 모듈을 임포트하고 데이터를 받아준다. 여기서는 보스턴 집값을 사용했다. 그러고 나서 Permutation Importance를 비교를 위해 의사결정나무와 Adaboost 알고리즘으로 예측 모형을 학습했다.
import pandas as pd
import matplotlib.pyplot as plt

from sklearn.inspection import permutation_importance
from sklearn.datasets import load_boston
from sklearn.tree import DecisionTreeRegressor
from sklearn.ensemble import AdaBoostRegressor

## 보스턴 데이터
boston = load_boston()
df = pd.DataFrame(boston.data, columns=boston.feature_names)
df['MEDV'] = boston.target
X = df[['AGE', 'RAD', 'TAX', 'DIS', 'RM', 'LSTAT', 'B', 'INDUS', 'CHAS']].values
y = df['MEDV'].values

## 예측 모형 모형 적합
decistion_tree = DecisionTreeRegressor(max_depth=6, random_state=0).fit(X, y)
adaboost = AdaBoostRegressor(base_estimator=DecisionTreeRegressor(max_depth=3),
                             random_state=0).fit(X, y)
- permutation_importance 사용법 -
permutation_importance은 학습된 모형, X 데이터, y 데이터, 재배열(Permutation) 횟수를 기본적인 인자로 받게 되어 있다.
decision_tree_pi = permutation_importance(decistion_tree, X, y,
                                          n_repeats=30, random_state=10)
adaboost_pi = permutation_importance(adaboost, X, y,
                                          n_repeats=30, random_state=10)
위 코드를 수행하면 재배열 횟수만큼의 결과를 배열로 담고 있는 importances, 이에 대한 평균값인 importances_mean, 표준편차 importances_std를 알 수 있다.
print('첫 번째 변수의 개별 PI :', decision_tree_pi.importances[0]) ## 원래는 n_repeats 만큼 저장
print('PI 평균:', decision_tree_pi.importances_mean)
print('PI 표준편차:', decision_tree_pi.importances_std)

이번엔 시각화를 해보자. Permutation Importance를 계산하고 중요도 크기 순으로 막대 그래프로 나타낸 것이다. 또한 importances_std를 이용하여 에러 막대도 같이 표시했다.
# permutation importance 시각화 함수
def plot_importance(importance, importance_std, ax, x_label, y_label='Importance'):
    temp1 = [f'x{i}' for i in range(len(importance))]
    temp2 = importance
    temp3 = importance_std
    result = sorted(zip(temp1, temp2, temp3), key=lambda x:x[1])
    label = [x[0] for x in result]
    value = [x[1] for x in result]
    value_2 = [x[2] for x in result]
    ax.barh(label, value, xerr=value_2, height=0.5)
    ax.set_xlabel(x_label, fontsize=20)
    ax.set_ylabel(y_label, fontsize=20)

# 시각화
fig, axs = plt.subplots(1, 2)
fig.set_facecolor('white')
fig.set_figwidth(12)
fig.set_figheight(7)

ax1 = plt.subplot(1, 2, 1)
ax2 = plt.subplot(1, 2, 2)
plot_importance(decision_tree_pi.importances_mean,
                decision_tree_pi.importances_std, ax1, 'Decision Tree')
plot_importance(adaboost_pi.importances_mean,
                adaboost_pi.importances_std, ax2, 'AdaBoost', '')
plt.show()


댓글