Scikit-Learn(sklearn)에서는 K-Means 클러스터링 알고리즘을 수행할 수 있는 기능을 제공하는데 KMeans 클래스가 바로 오늘의 주인공이다. 이번 포스팅에서는 KMeans의 사용법을 알아보자.
K-Means 클러스터링의 대한 개념은 아래 포스팅을 참고하기 바란다.
11. K-Means 클러스터링(Clustering, 군집화)에 대해서 알아보자 with Python
11. K-Means 클러스터링(Clustering, 군집화)에 대해서 알아보자 with Python
이번 포스팅에서는 클러스터링(Clustering, 군집화)의 대표적인 알고리즘 중에 하나로 K-Means 클러스터링에 대해서 알아보려고 한다. 여기서 다루는 내용은 다음과 같다. 1. K-Means 클러스터링(Clusterin
zephyrus1111.tistory.com
KMeans 사용법 알아보기
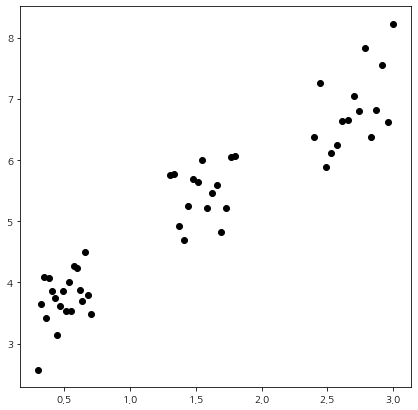
먼저 데이터를 생성하고 어떻게 생겼는지 확인하기 위해 산점도를 그려보자.
import numpy as np
import matplotlib.pyplot as plt

np.random.seed(100)
num_data = 50

x11 = np.linspace(0.3,0.7,20)
x12 = np.linspace(1.3,1.8,15)
x13 = np.linspace(2.4,3,15)
x1 = np.concatenate((x11,x12,x13),axis=None)
error = np.random.normal(1,0.5,num_data)
x2 = 1.5*x1+2+error

fig = plt.figure(figsize=(7,7))
fig.set_facecolor('white')
plt.scatter(x1, x2, color='k')
plt.show()
KMeans에서 주로 사용하는 인자는 n_clusters와 init이다. n_cluster는 군집의 개수이고 init은 알고리즘 초기 중심치이다. 이때 init 인자에는 데이터 샘플을 이용하여 K-Means 클러스터링 알고리즘을 통해 얻은 중심치를 초기 중심치로 하는 'k-means++', 랜덤 하게 n_clusters 개수만큼 선택하는 'random'을 선택할 수 있으며 초기 중심치를 2차원 배열로 줄 수도 있고 초기 중심치를 설정하는 함수를 넣을 수도 있다. 여기에서는 초기 중심치를 넣을 수 있는 함수를 init 인자에 넣는 법을 살펴보겠다. 다른 init 설정 방법은 주석을 참고하면 된다.
이제 초기 중심치를 세팅하는 함수를 먼저 만들어보자. 해당 함수는 첫 번째 x값을 클러스터 개수만큼 분위수를 정하고 각 분위수 구간에 해당하는 평균값을 초기 중심치로 정한 것이다. 이때 X, n_clusters, random_state 인자가 차례대로 정의되어 있어야 한다.
def select_init(X, n_clusters, random_state=0):
    q_unit = 1/n_clusters
    target_array = X[:, 0]
    center = []
    for i in range(n_clusters):
        if i==0:
            lower_bound = np.min(target_array)-10
        else:
            lower_bound = np.quantile(target_array, q_unit)

        if i == n_clusters-1:
            upper_bound = np.quantile(target_array, 1)
        else:
            upper_bound = np.quantile(target_array, q_unit*(i+1))

        idx = np.where((target_array>=lower_bound)&(target_array<upper_bound))
        sub_X = X[idx, :]
        center.append(np.mean(sub_X, axis=1).flatten().tolist())

    return np.array(center)
이제 K-Means 클러스터링 알고리즘을 돌려보자. 먼저 클러스터 개수는 3개 그리고 init 인자에는 앞에서 정의한 select_init 함수를 넣어주었다. 그러고 나서 fit 메서드에 데이터를 넣고 실행해야 클러스터링이 수행된다. 그런 다음 labels_ 속성에 주어진 데이터의 클러스터링 라벨을 확인할 수 있다. 또한 predict를 사용하여 새로운 데이터의 클러스터를 예측할 수도 있다.
from sklearn.cluster import KMeans

X = np.c_[x1, x2]
## init='k-means++'
## init='random'
## init=np.array([[0.5, 3.9], [1.7,5.5], [2.7,7]])

kmeans = KMeans(n_clusters=3, random_state=0, init=select_init) ## KMeans 초기화
kmeans.fit(X) ## 클러스터링 알고리즘 수행

labels = kmeans.labels_ ## 클러스터링 결과

print(kmeans.predict([[2.2, 3]])) ## 새로운 데이터 클러스터 예측

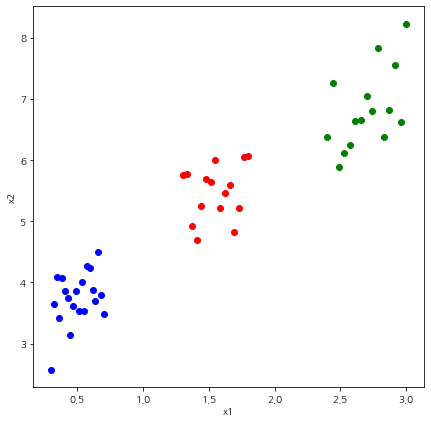
새로운 데이터 (2.2, 3)의 클러스터 라벨은 0인 것을 알 수 있다. 여기에서 끝나면 심심하므로 클러스터링 결과를 시각적으로 살펴보자.
fig = plt.figure(figsize=(7,7))
fig.set_facecolor('white')
for i, label in enumerate(labels):
    if label == 0:
        color = 'blue'
    elif label ==1:
        color = 'red'
    else:
        color = 'green'
    plt.scatter(X[i,0],X[i,1], color=color)

plt.xlabel('x1')
plt.ylabel('x2')
plt.show()
여기서 다루지 않는 KMeans의 기능은 Scikit-Learn 문서를 참고하기 바란다.


댓글