Scikit-Learn(sklearn)에서는 가우시안 혼합 모형(Gaussian Mixture Model) 클러스터링 알고리즘을 수행할 수 있는 클래스를 구현하였다. GaussianMixture가 바로 그것이다. 이번 포스팅에서는 GaussianMixture를 이용한 가우시안 혼합 모형(Gaussian Mixture Model) 클러스터링을 해보고자 한다.
가우시안 혼합 모형(Gaussian Mixture Model) 클러스터링 알고리즘의 개념은 아래 포스팅을 참고하기 바란다.
12. Gaussian Mixture Model(가우시안 혼합 모형) 클러스터링(군집 분석)에 대해서 알아보자 with Python
12. Gaussian Mixture Model(가우시안 혼합 모형) 클러스터링(군집 분석)에 대해서 알아보자 with Python
이번 포스팅에서는 K-Means 클러스터링과 더불어 군집 분석에서 자주 사용되는 Gaussian Mixture Model 클러스터링(가우시안 혼합 모형 군집화)에 대해서 알아보고 파이썬(Python)으로 구현해보고자 한다.
zephyrus1111.tistory.com
GaussianMixture 사용법 알아보기
먼저 데이터를 생성하고 산점도를 통해 데이터 분포를 살펴보자.
import numpy as np
import matplotlib.pyplot as plt
import matplotlib
matplotlib.rcParams['axes.unicode_minus'] = False

import warnings
warnings.filterwarnings('ignore')

np.random.seed(3)
sample_size=100
x1 = 3*np.random.rand(sample_size)
x2 = np.random.rand(sample_size)+1
x3 = 2*np.random.rand(sample_size)+2

y1 = 2*x1+2+np.random.randn(sample_size)
y2 = 4*x2+5+np.random.randn(sample_size)
y3 = 0.2*x3+np.random.randn(sample_size)

y = np.array(list(y1)+list(y2)+list(y3))
x = np.array(list(x1)+list(x2)+list(x3))

fig = plt.figure(figsize=(8,8))
fig.set_facecolor('white')
plt.scatter(x, y, color='k')
plt.show()

GaussianMixture 클래스는 클러스터 개수(n_components), 공분산 타입(covariance_type) 그리고 초기 중심치(means_init) 인자를 자주 사용한다. 이때 공분산 타입은 'full’, ‘tied’, ‘diag’, ‘spherical’로 설정할 수 있으며 그 의미는 다음과 같다.
- ‘full’: each component has its own general covariance matrix.
- ‘tied’: all components share the same general covariance matrix.
- ‘diag’: each component has its own diagonal covariance matrix.
- ‘spherical’: each component has its own single variance.
클러스터링은 fit 메서드를 통해서 수행한다. 클러스터링 결과는 predict 메서드를 이용하면 확인할 수 있다. 이제 코드를 통해 그 사용법을 확인해보자.
from sklearn.mixture import GaussianMixture

X = np.c_[x, y]
init_centers = np.array([[1.5,4], [3.5,0], [1.5, 11]]) # 초기 평균값

# 클러스터 개수 3개, 초기 평균 벡터 설정, 공분산 타입
gmm = GaussianMixture(n_components=3,
                      covariance_type='full',
                      means_init=init_centers,
                      random_state=100)
gmm.fit(X) # GMM 클러스터링 수행
labels = gmm.predict(X) # 최종 클러스터 라벨링
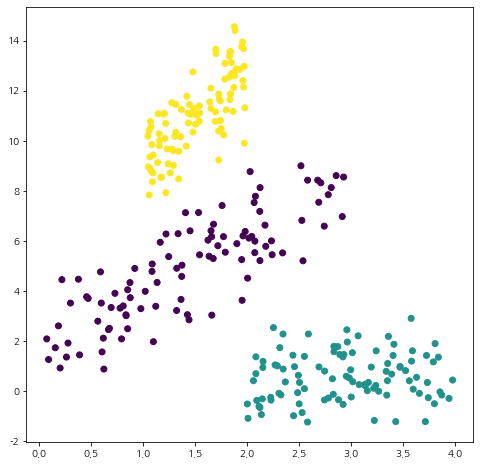
이대로 끝내면 허무하니까 시각화를 통해 클러스터링 결과를 눈으로 확인해보자.
fig = plt.figure(figsize=(8,8))
fig.set_facecolor('white')
plt.scatter(X[:,0], X[:,1], c=labels)
plt.show()
여기서 다루지 않는 GaussianMixture의 기능은 Scikit-Learn 문서를 참고하기 바란다.


댓글